One of the aha! moments that contribute significantly to the understanding of programming is the use of a debugger.
With the help of such a debugger, it’s possible to pause a program at a certain point, to go through the following statements step by step, to look at the variable assignments, and much more. Simply put, debuggers are a great way to understand the flow of a program.
A Simple Code Example
Let's take the findDuplicates() function shown below as an example. This function is to output the duplicate entries for the numbers array. However, the function contains a small error that causes each entry to be recognized as duplicate.
function findDuplicates() {
const numbers = [2, 4, 5, 2, 5, 8, 5, 4711];
for(let i=0; i<numbers.length; i++) {
const numberAtI = numbers[i];
for(let j=0; j<numbers.length; j++) {
const numberAtJ = numbers[j];
if(numberAtI === numberAtJ) {
console.log(`Found duplicate: ${numberAtI}`);
}
}
}
}
document.addEventListener('DOMContentLoaded', findDuplicates);
The HTML file that embeds the code is shown below. This is also the file you open next in the browser (in Chrome, for example) to debug the JavaScript code there.
<!DOCTYPE html>
<html>
<head lang="en">
<meta charset="UTF-8">
<title>Debugging example</title>
<link rel="stylesheet" href="styles/main.css" type="text/css">
</head>
<body>
<script src="scripts/main.js"></script>
</body>
</html>
Defining Breakpoints
To open the debugging section of CDT, select View > Developer > JavaScript Console, and then go to the Sources tab. On the left side, you’ll see (among other things) the JavaScript source code file that is embedded in the called HTML file. Double-click this file (main.js) to select it and open it in the built-in editor.
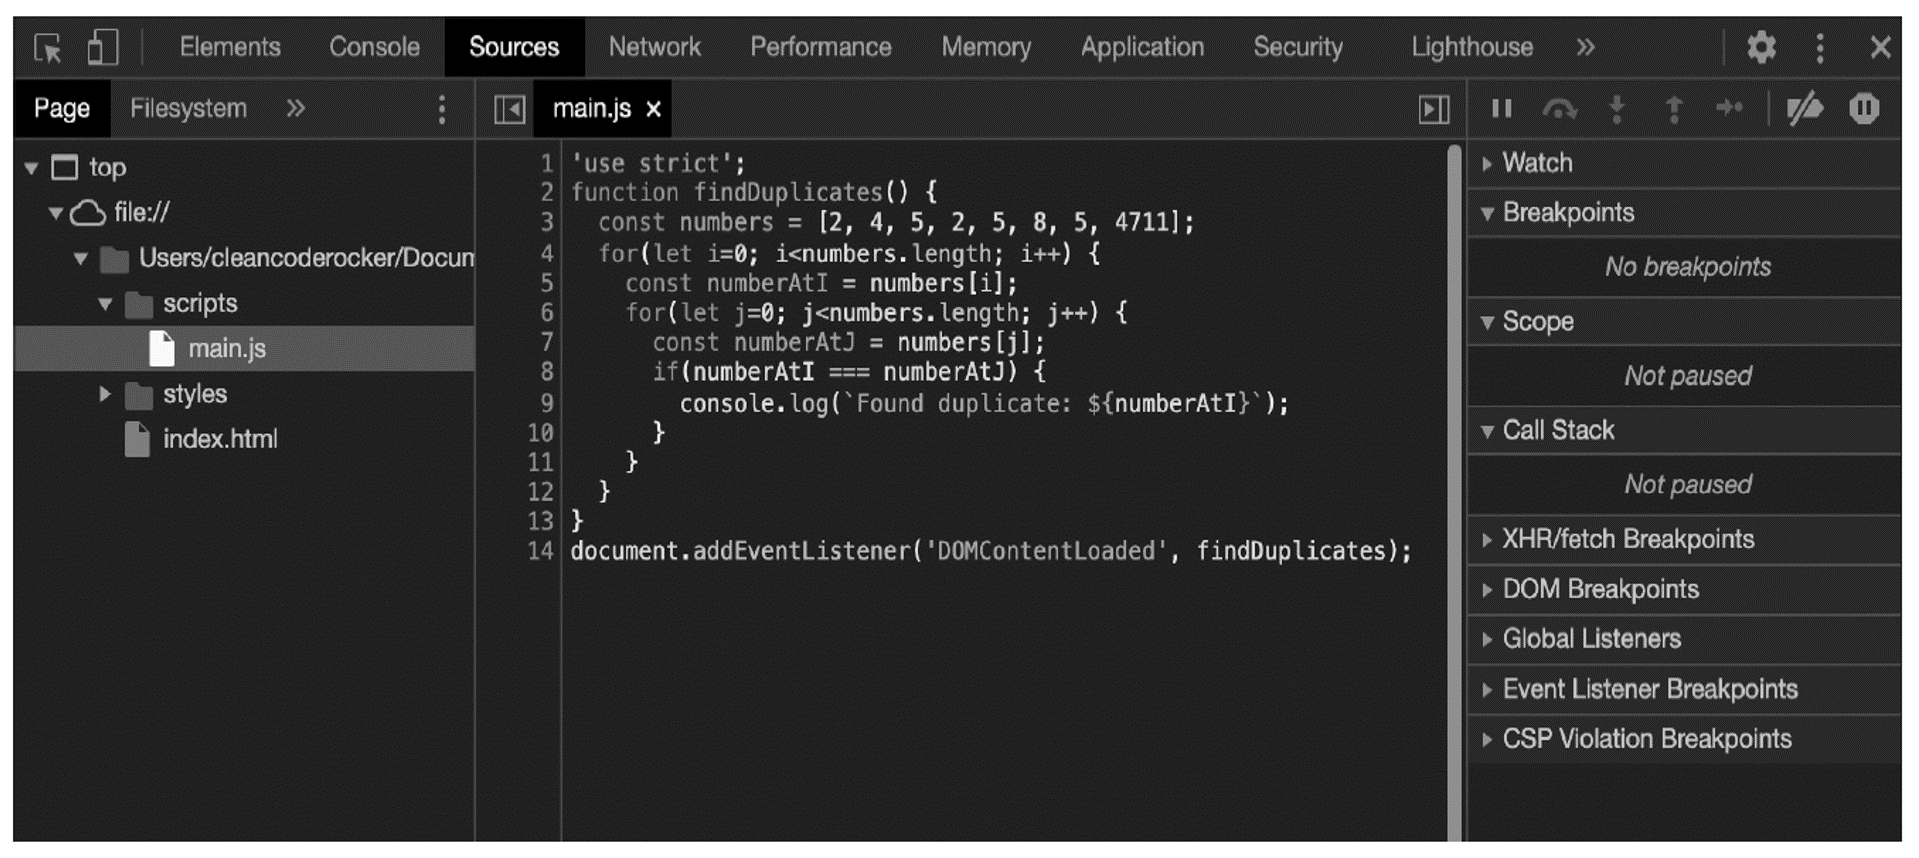
This view can now be used to define breakpoints at which the execution of the program is to be stopped. Such breakpoints enable the developer to jump into a program at a certain point in time and execute the following statements step by step, starting at the breakpoint.
To define a breakpoint, simply click to the left of the corresponding line in the source code (where the line number is). The blue mark shows that a breakpoint is defined for the corresponding line.
3
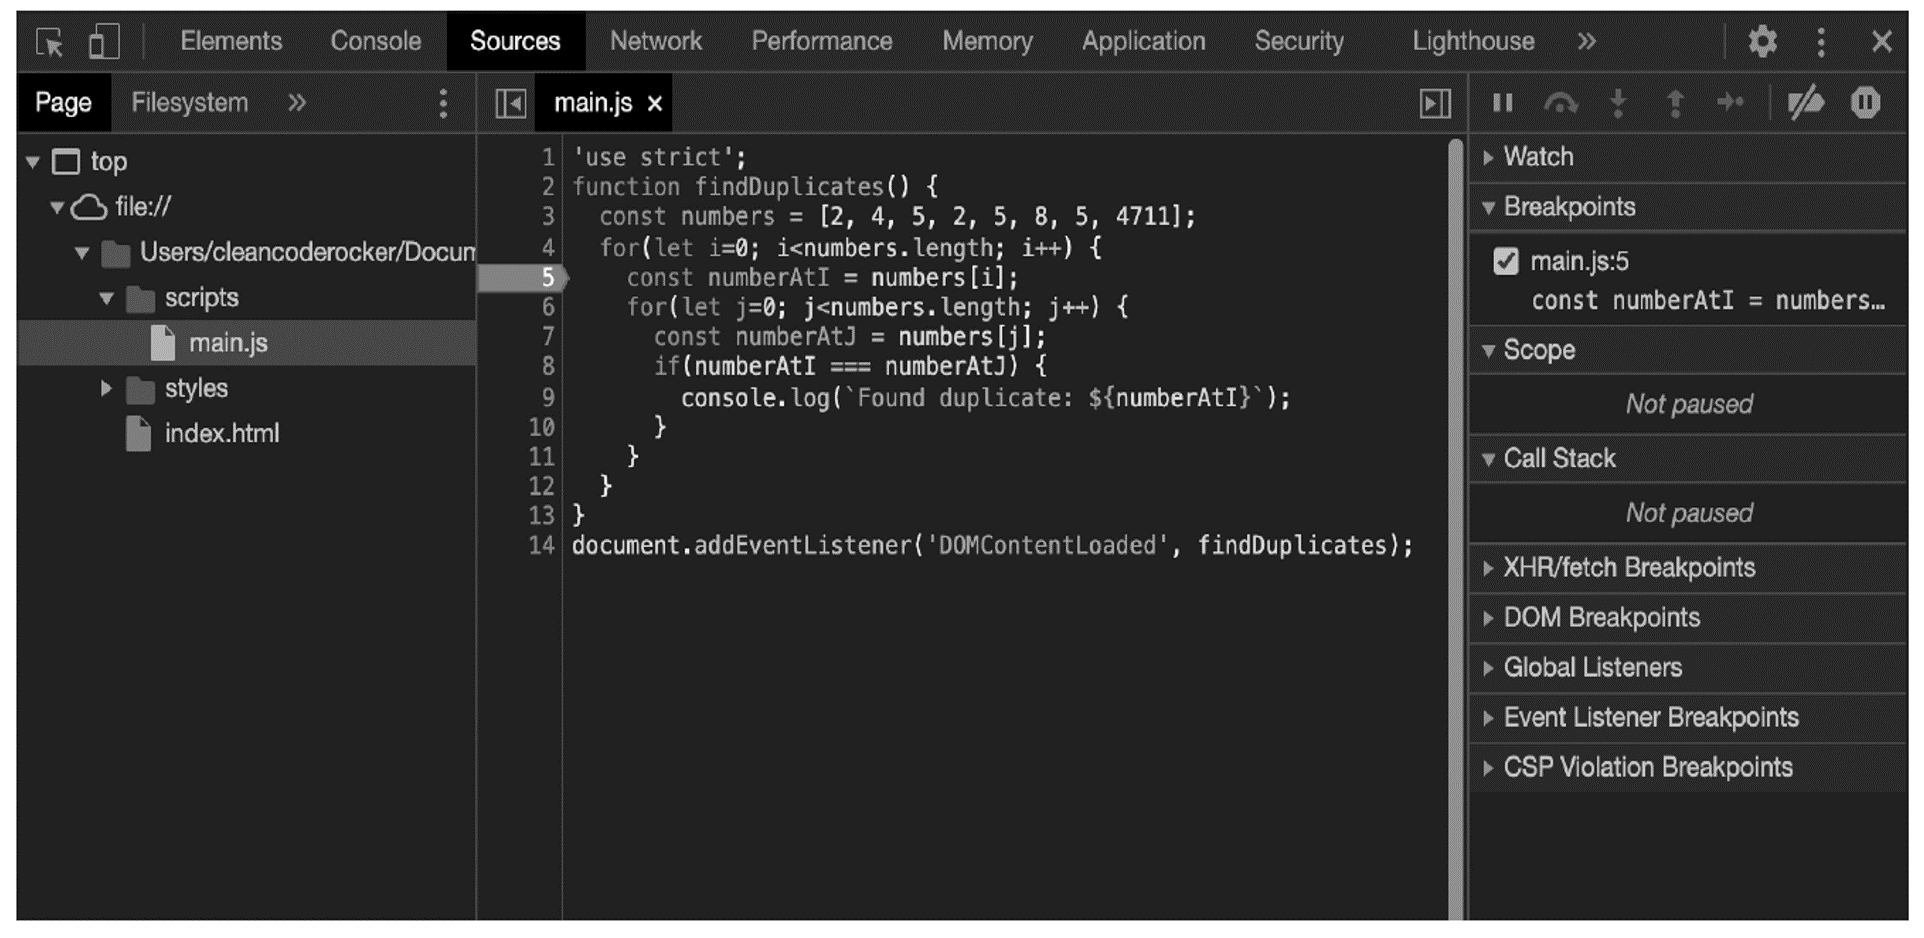
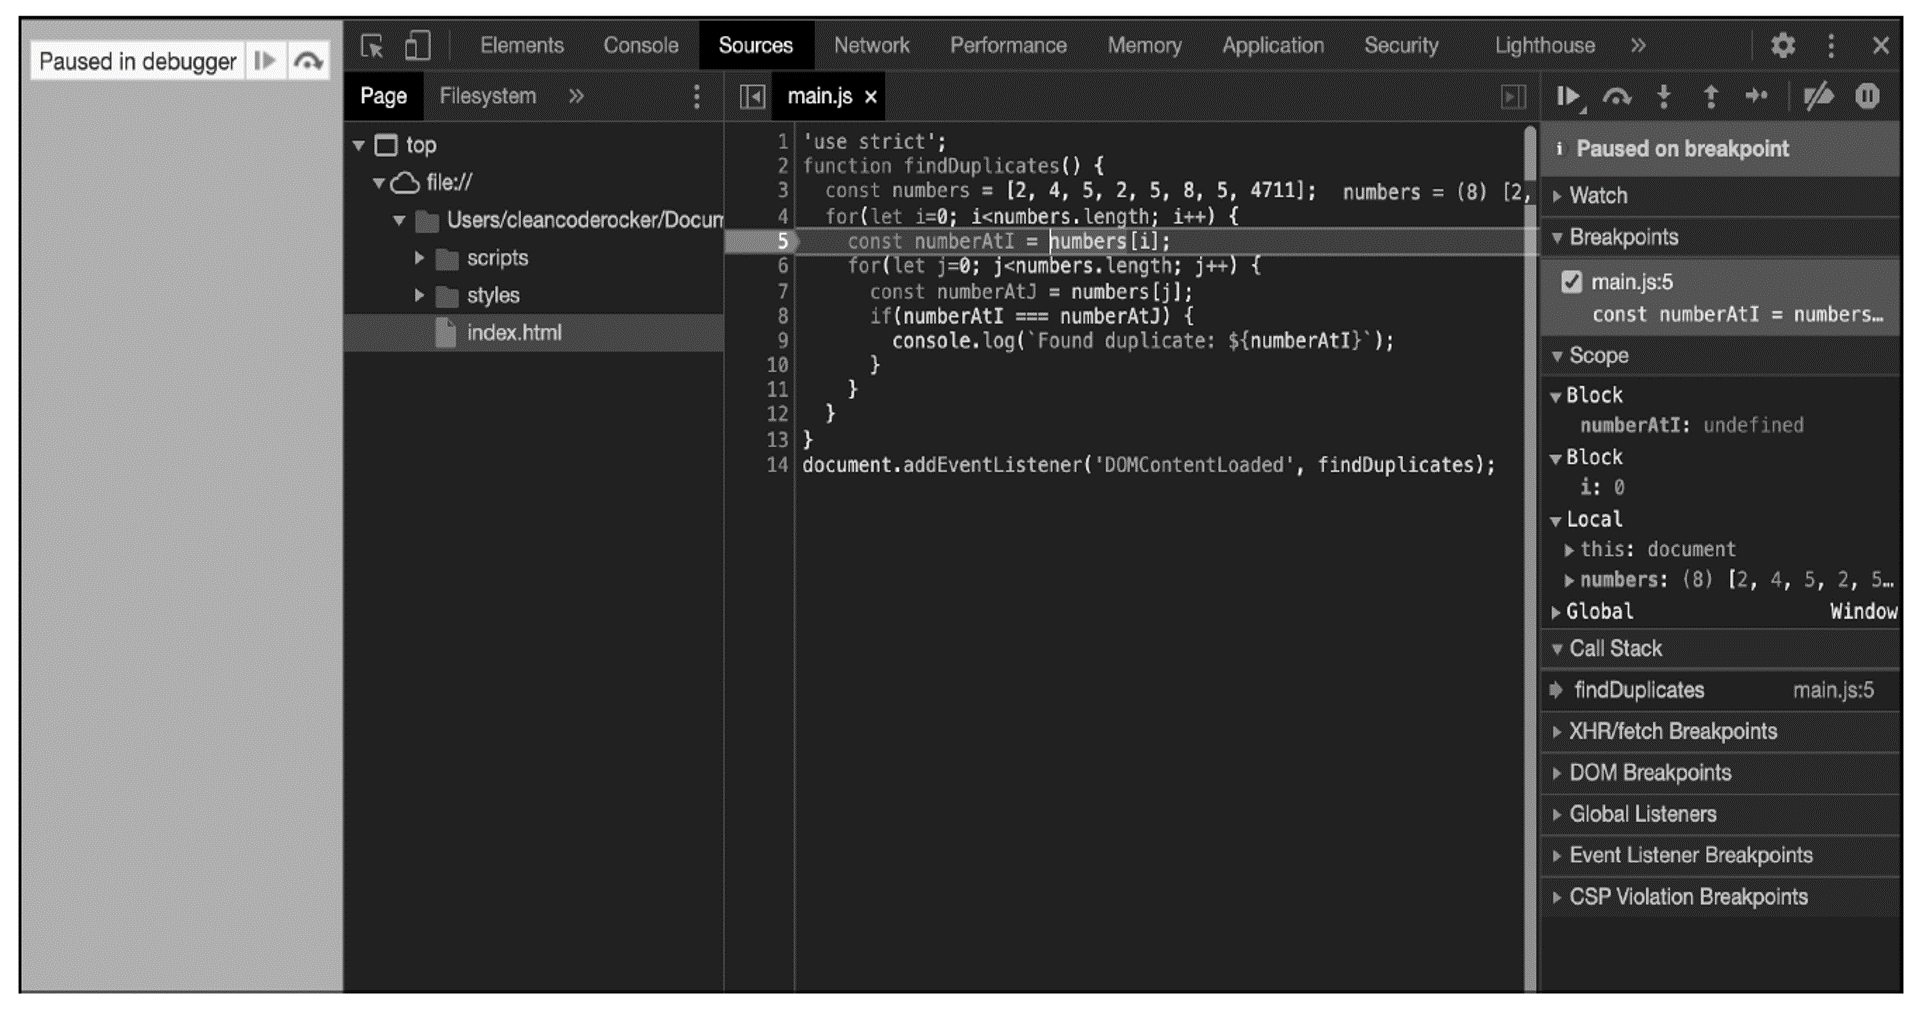
When you subsequently reload the HTML file in the browser, the program stops exactly at the defined breakpoint.
Defining Breakpoints Using the debugger Keyword: As an alternative to defining breakpoints using CDT, you can also define breakpoints within the source code using the debugger keyword.
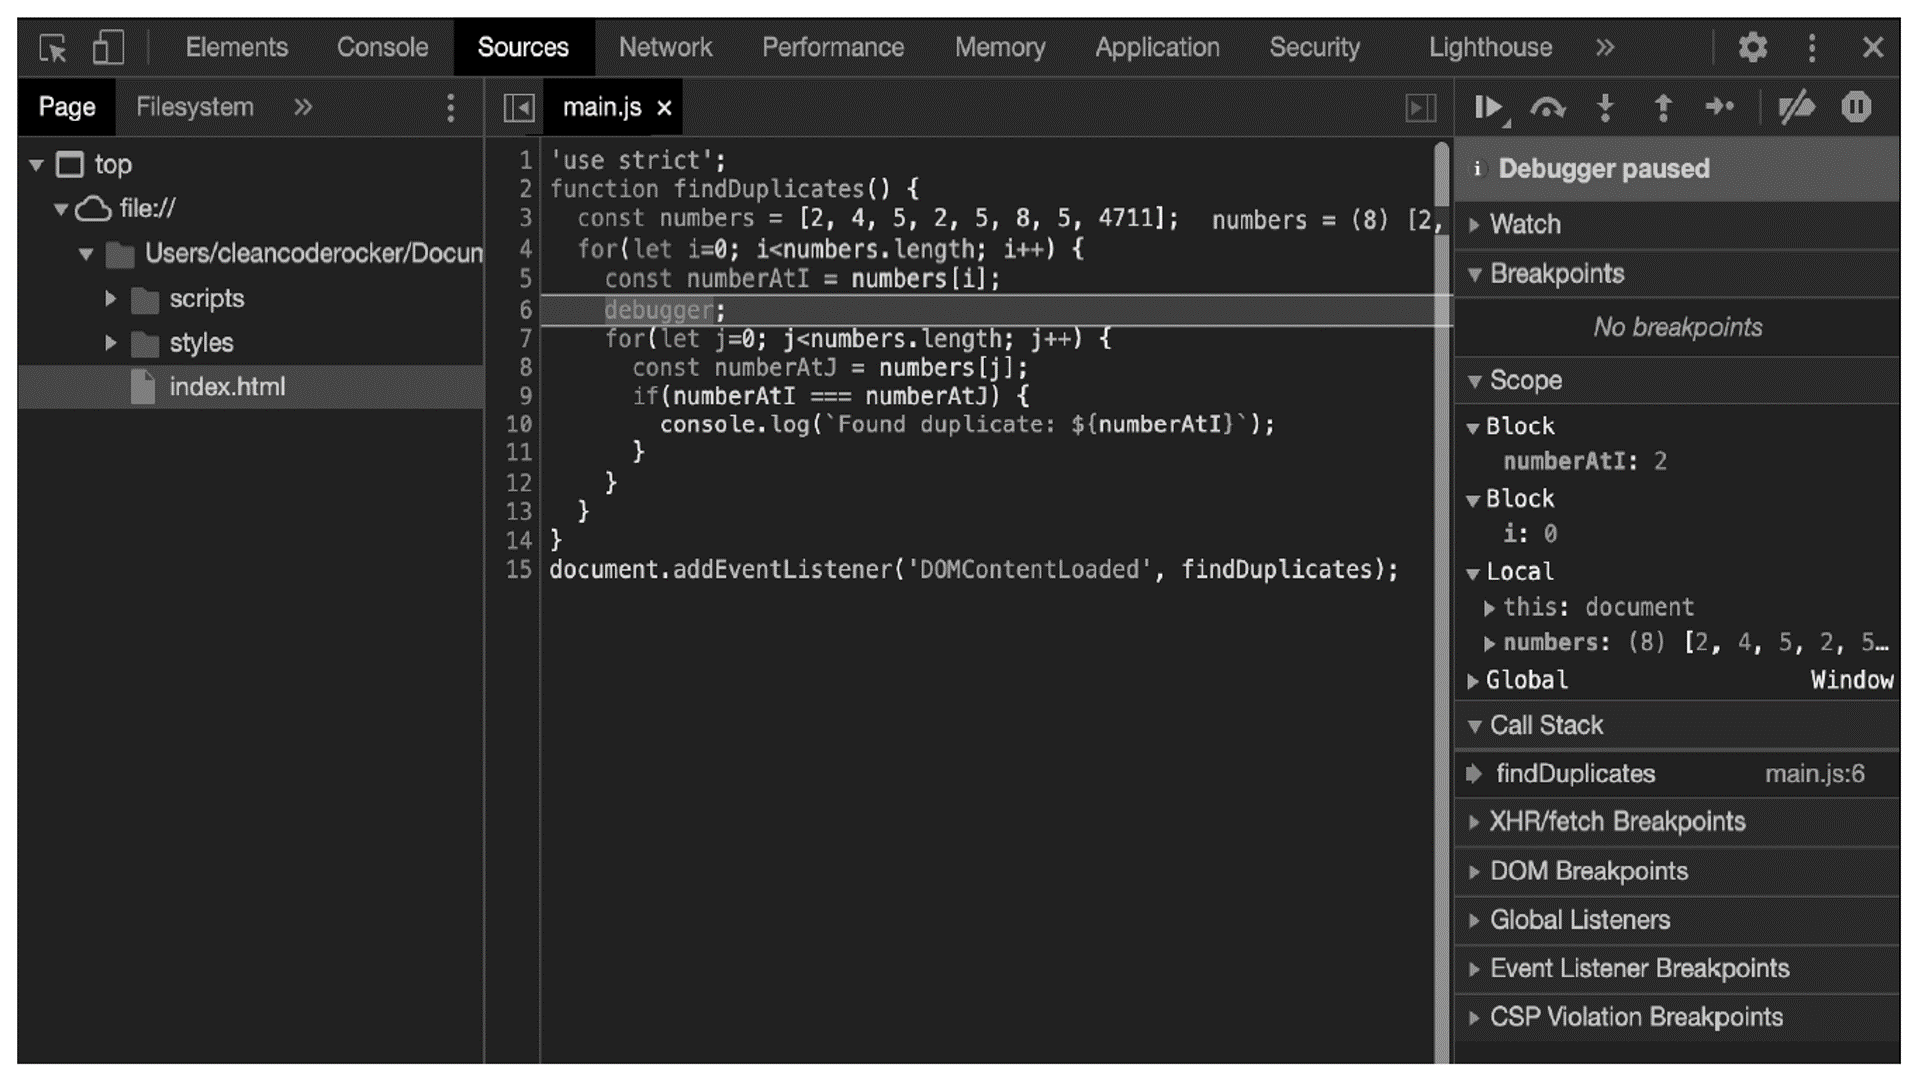
The keyword is part of the language and thus independent of the debugging tool used (there are others besides CDT, but we won’t discuss them here).
Viewing Variable Assignments
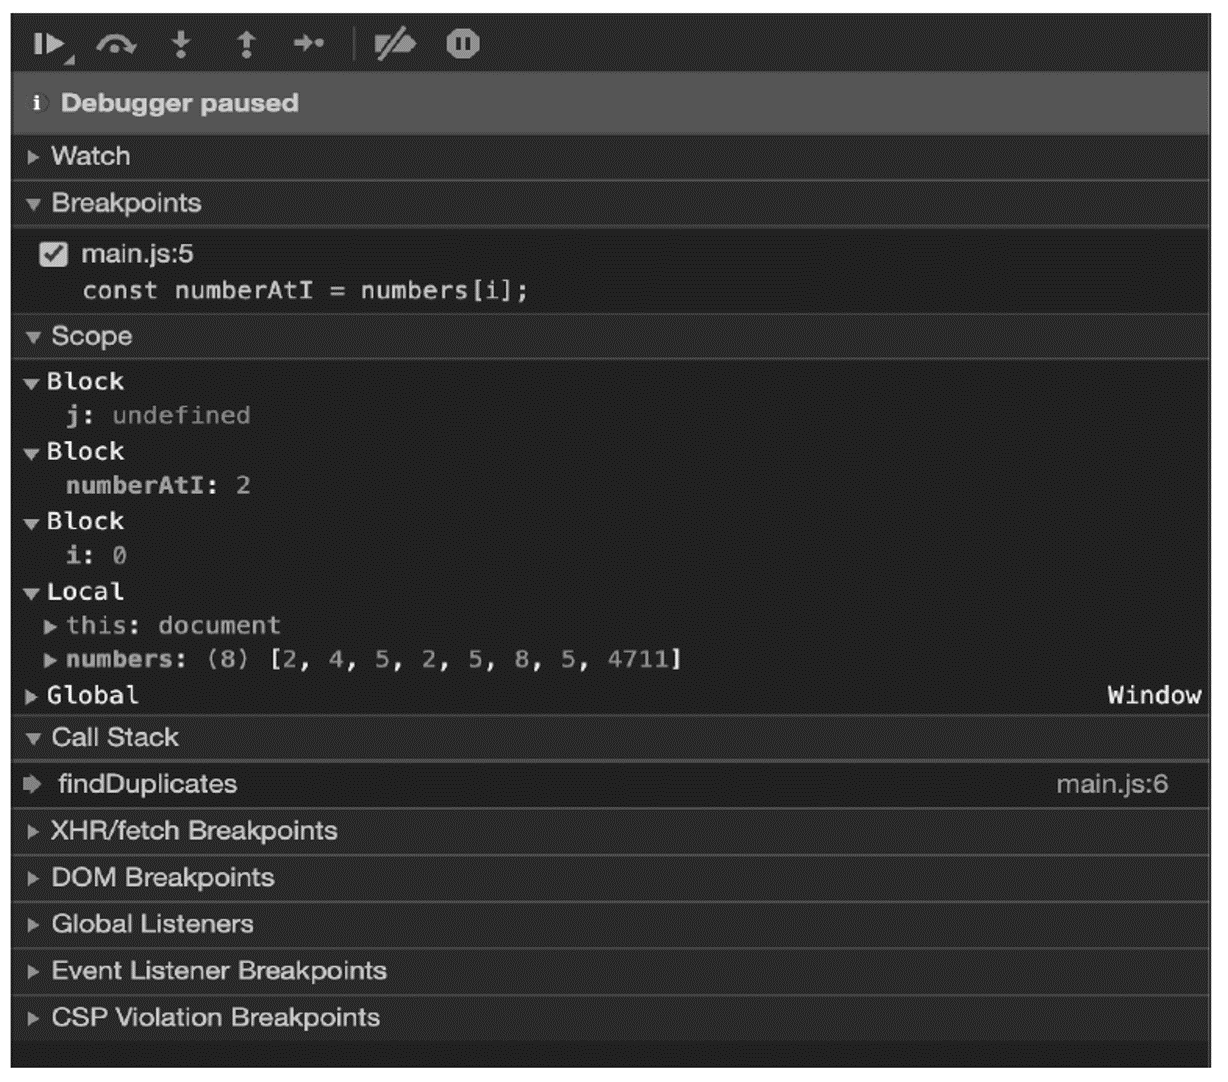
Once the program has been stopped, you can view the variable assignments—that is, the current values of the visible variables. These can be found in the Sources view on the right side under the Scope tab (see next figure). In the example, you can see that the numberAtI variable still has the value undefined (after all, the line where the program is stopped hasn’t been executed yet), and the i variable has a value of 0.
Running a Program Step by Step
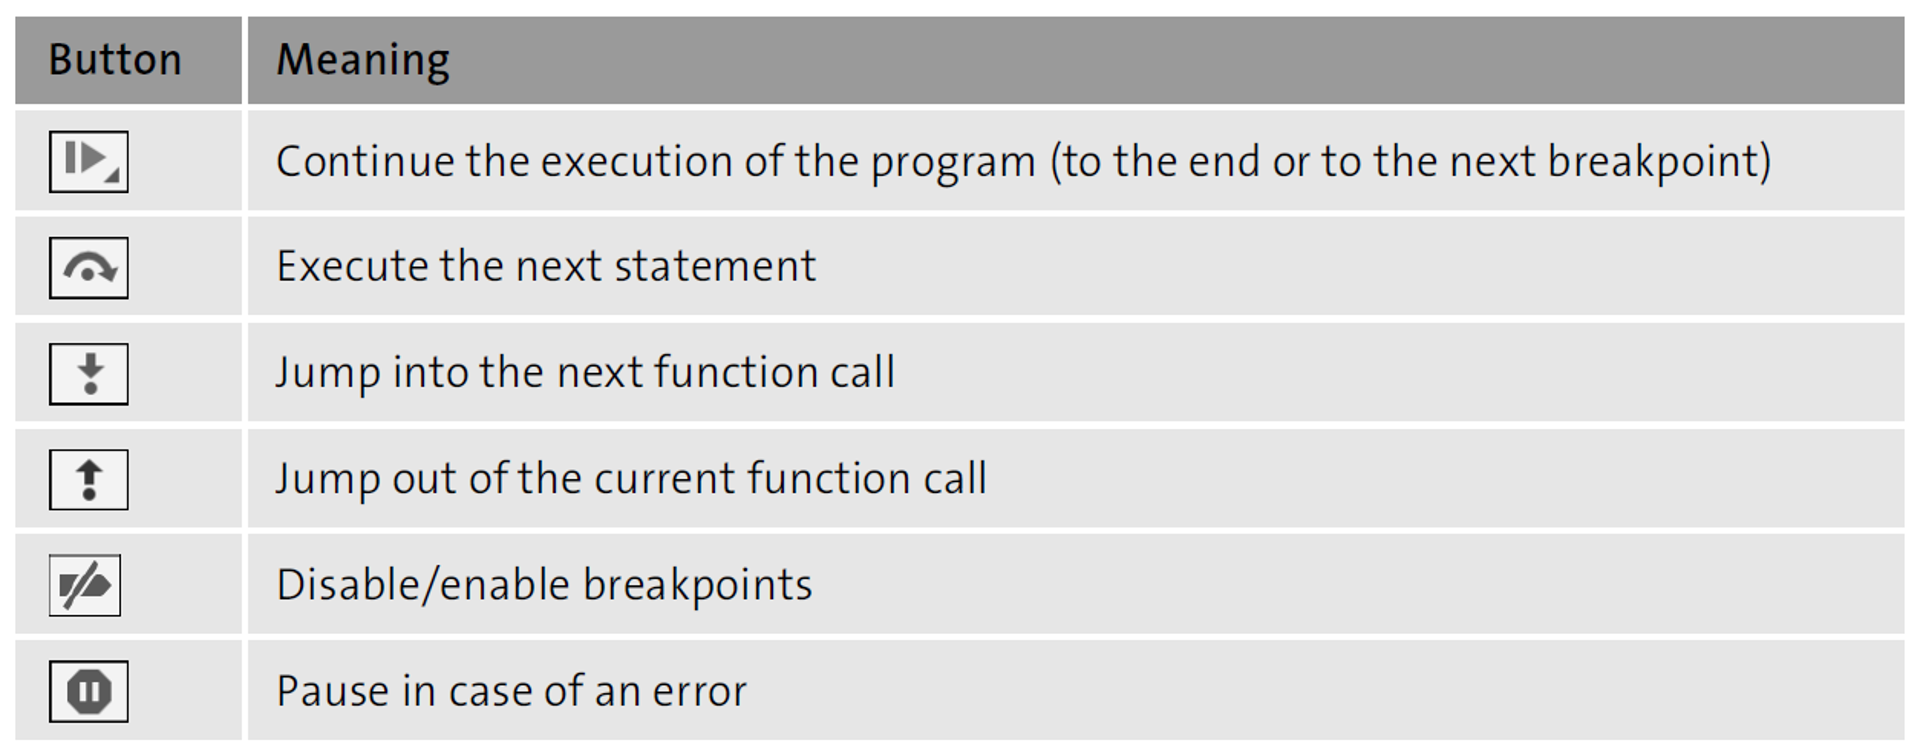
Using the navigation (on the top-right side), you also have the option to execute the source code manually step by step or statement by statement. The exact meanings of the different buttons are summarized in this table.
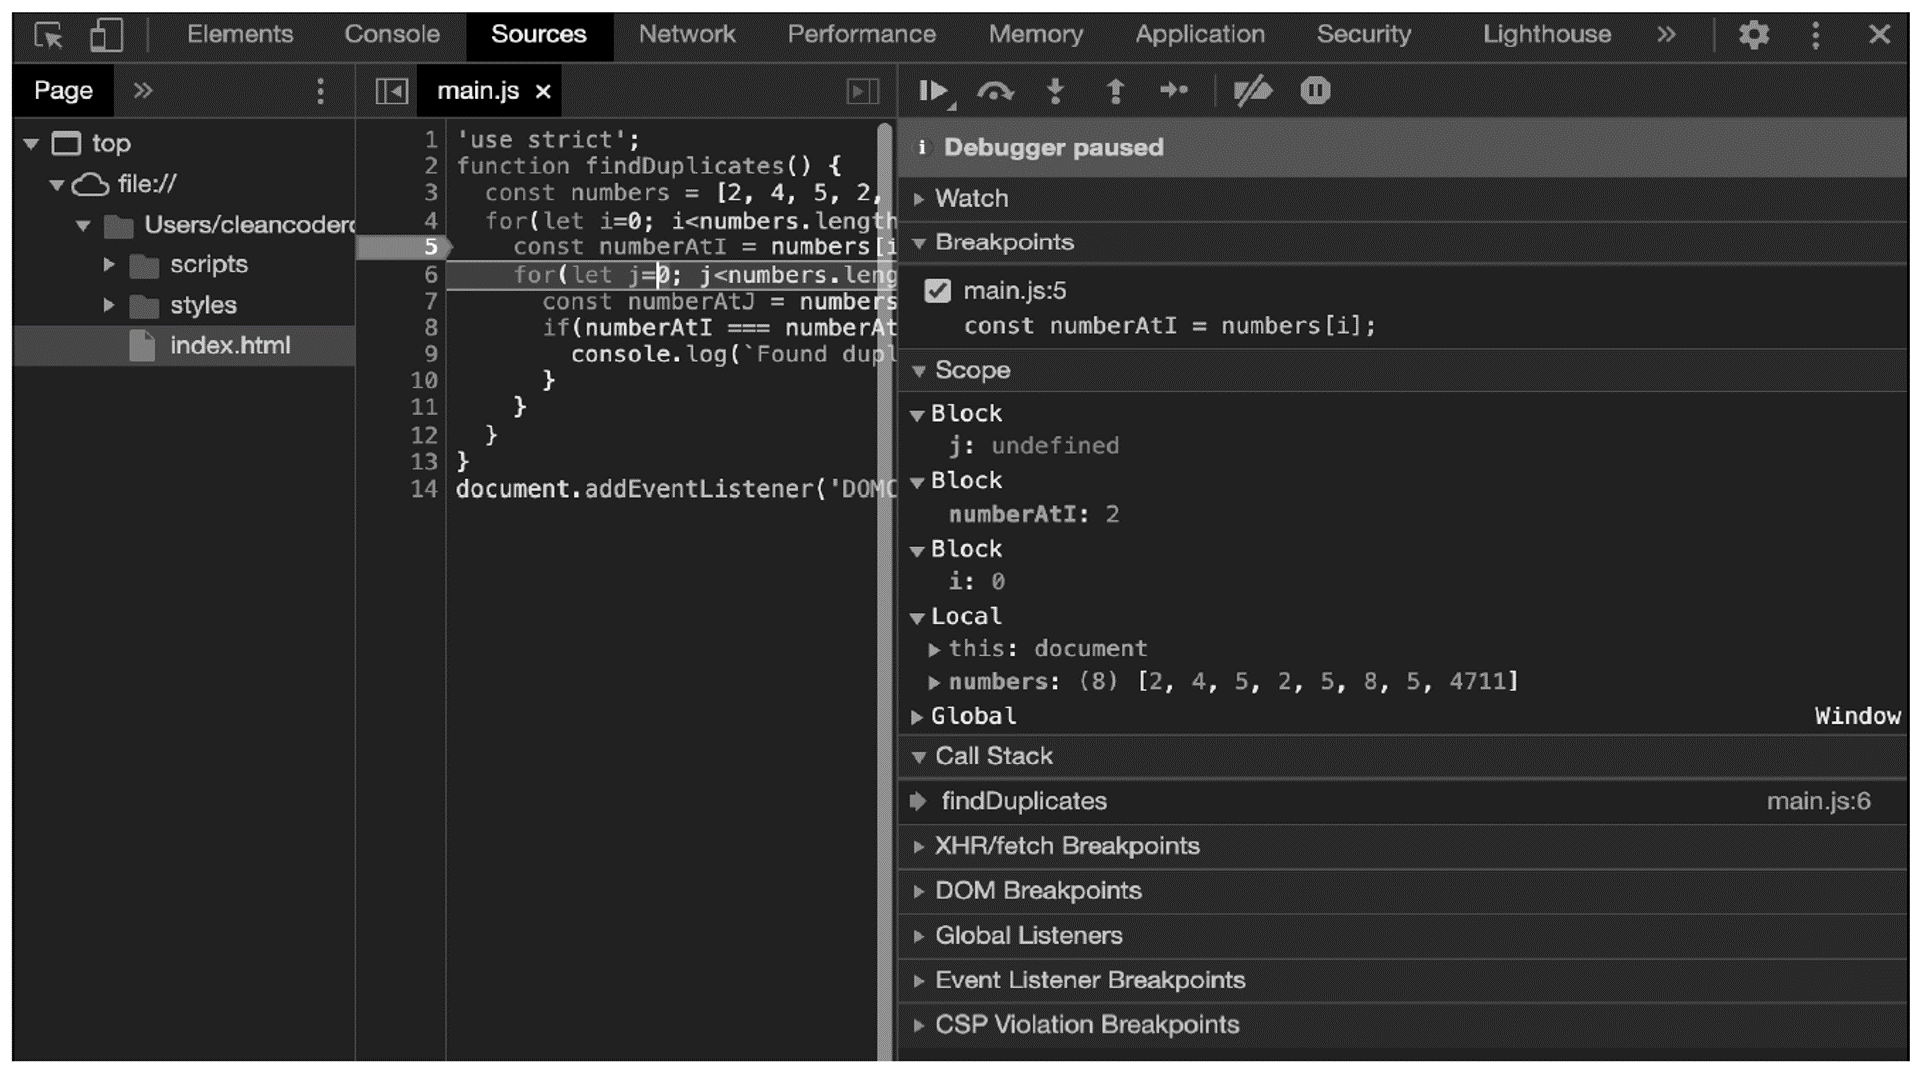
If you now click the button to execute the next statement from the breakpoint defined earlier, the const numberAtI = numbers[i] statement is executed, assigning the numberAtI variable a value of 2.
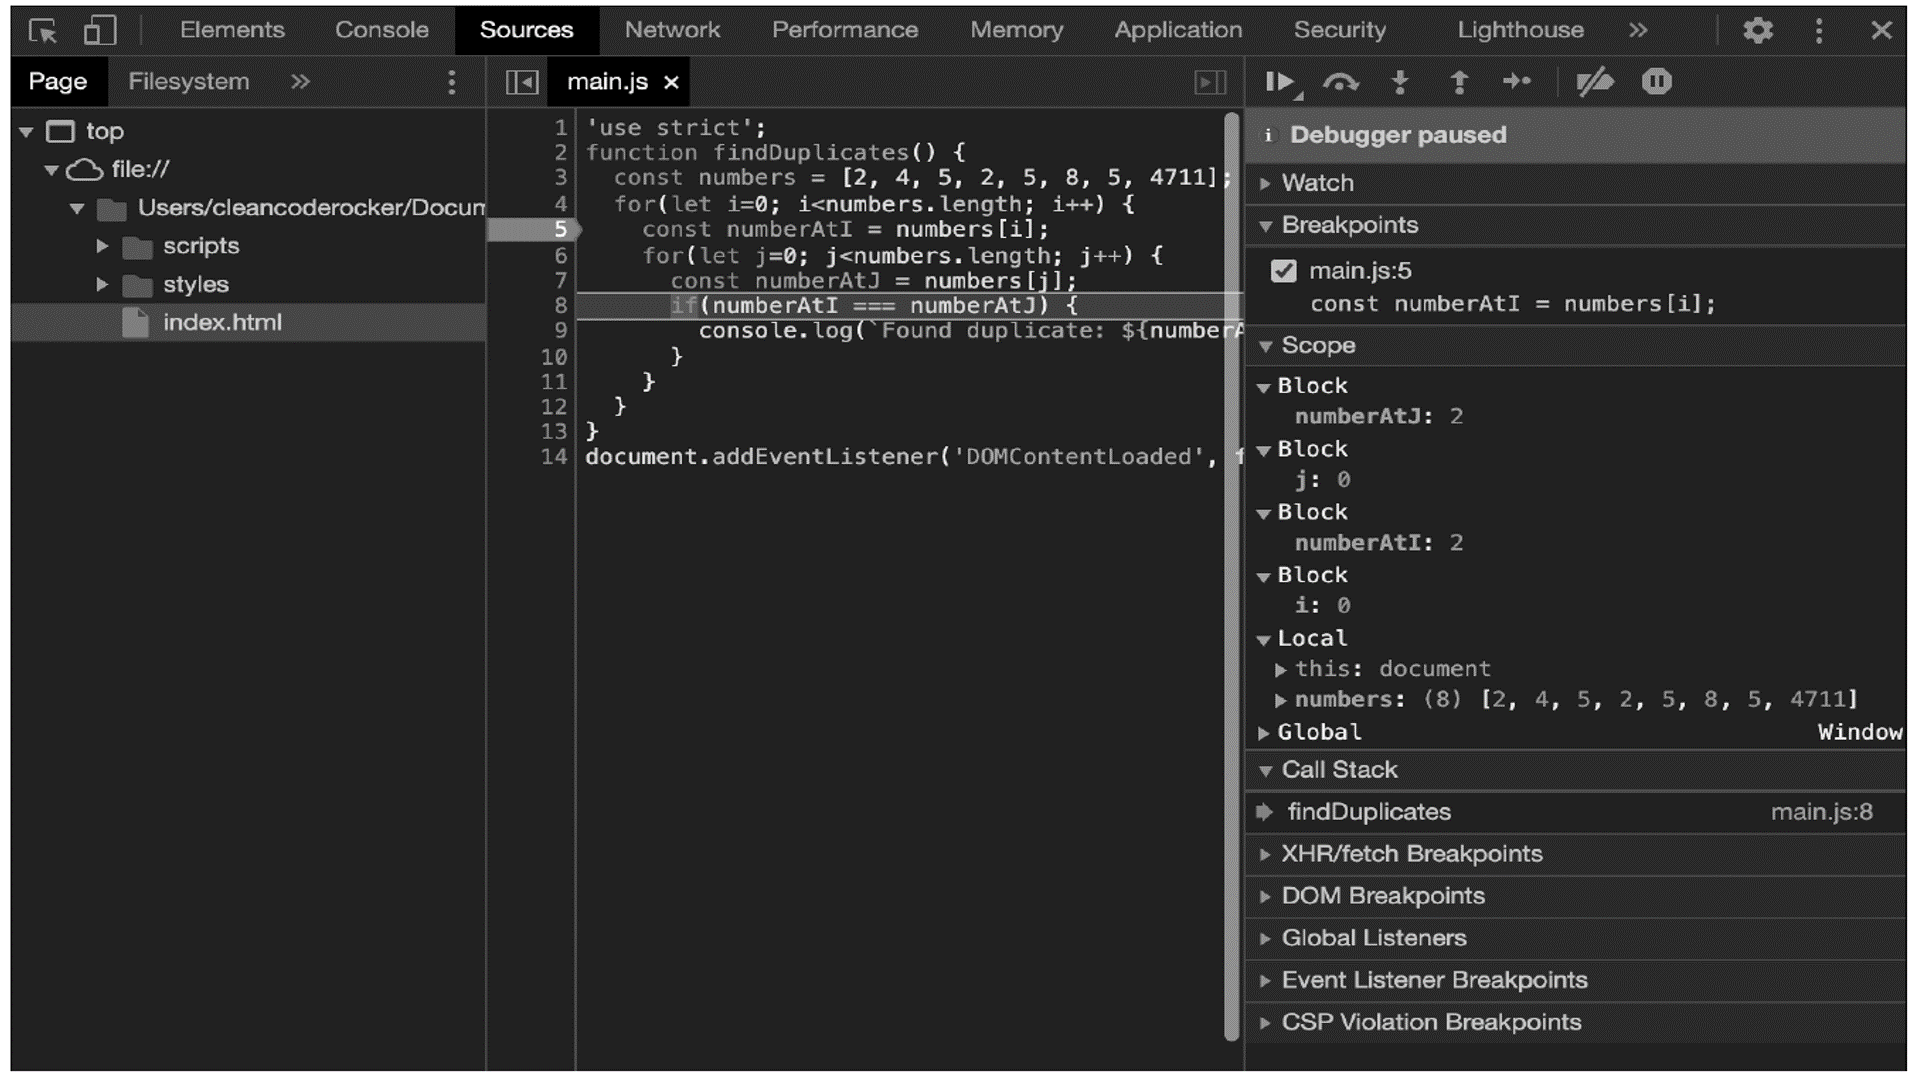
If you now execute the statements up to line 7 (next figure), you will be able to see straightaway where the error is in the program. The inner counting loop compares each element of the array (in the numberAtJ variable) with the current element of the outer loop (in the numberAtI variable), which means that each element—that is, each number— is also compared with itself.
To solve this problem (and thus fix the bug), it’s sufficient to let the inner counting loop count from position i+1. This compares the current element with all subsequent elements: the first element in the array (2) with the elements 4, 5, 2, 5, 8, 5, and 4711; the second element (4) with the elements 5, 2, 5, 8, 5, and 4711; and so on.
In this way, you not only prevent each element from being compared with itself, but also prevent two elements from being compared twice. The adapted source code is shown in here.
function findDuplicates() {
const numbers = [2, 4, 5, 2, 5, 8, 5, 4711];
for(let i=0; i<numbers.length; i++) {
const numberAtI = numbers[i];
for(let j=i+1; j<numbers.length; j++) {
const numberAtJ = numbers[j];
if(numberAtI === numberAtJ) {
console.log(`Found duplicate: ${numberAtI}`);
}
}
}
}
document.addEventListener('DOMContentLoaded', findDuplicates);
Defining Multiple Breakpoints
Of course, there is no reason that you shouldn't define several breakpoints within a program. You can then use the Continue button to "jump" to the next breakpoint occurring in the program flow.
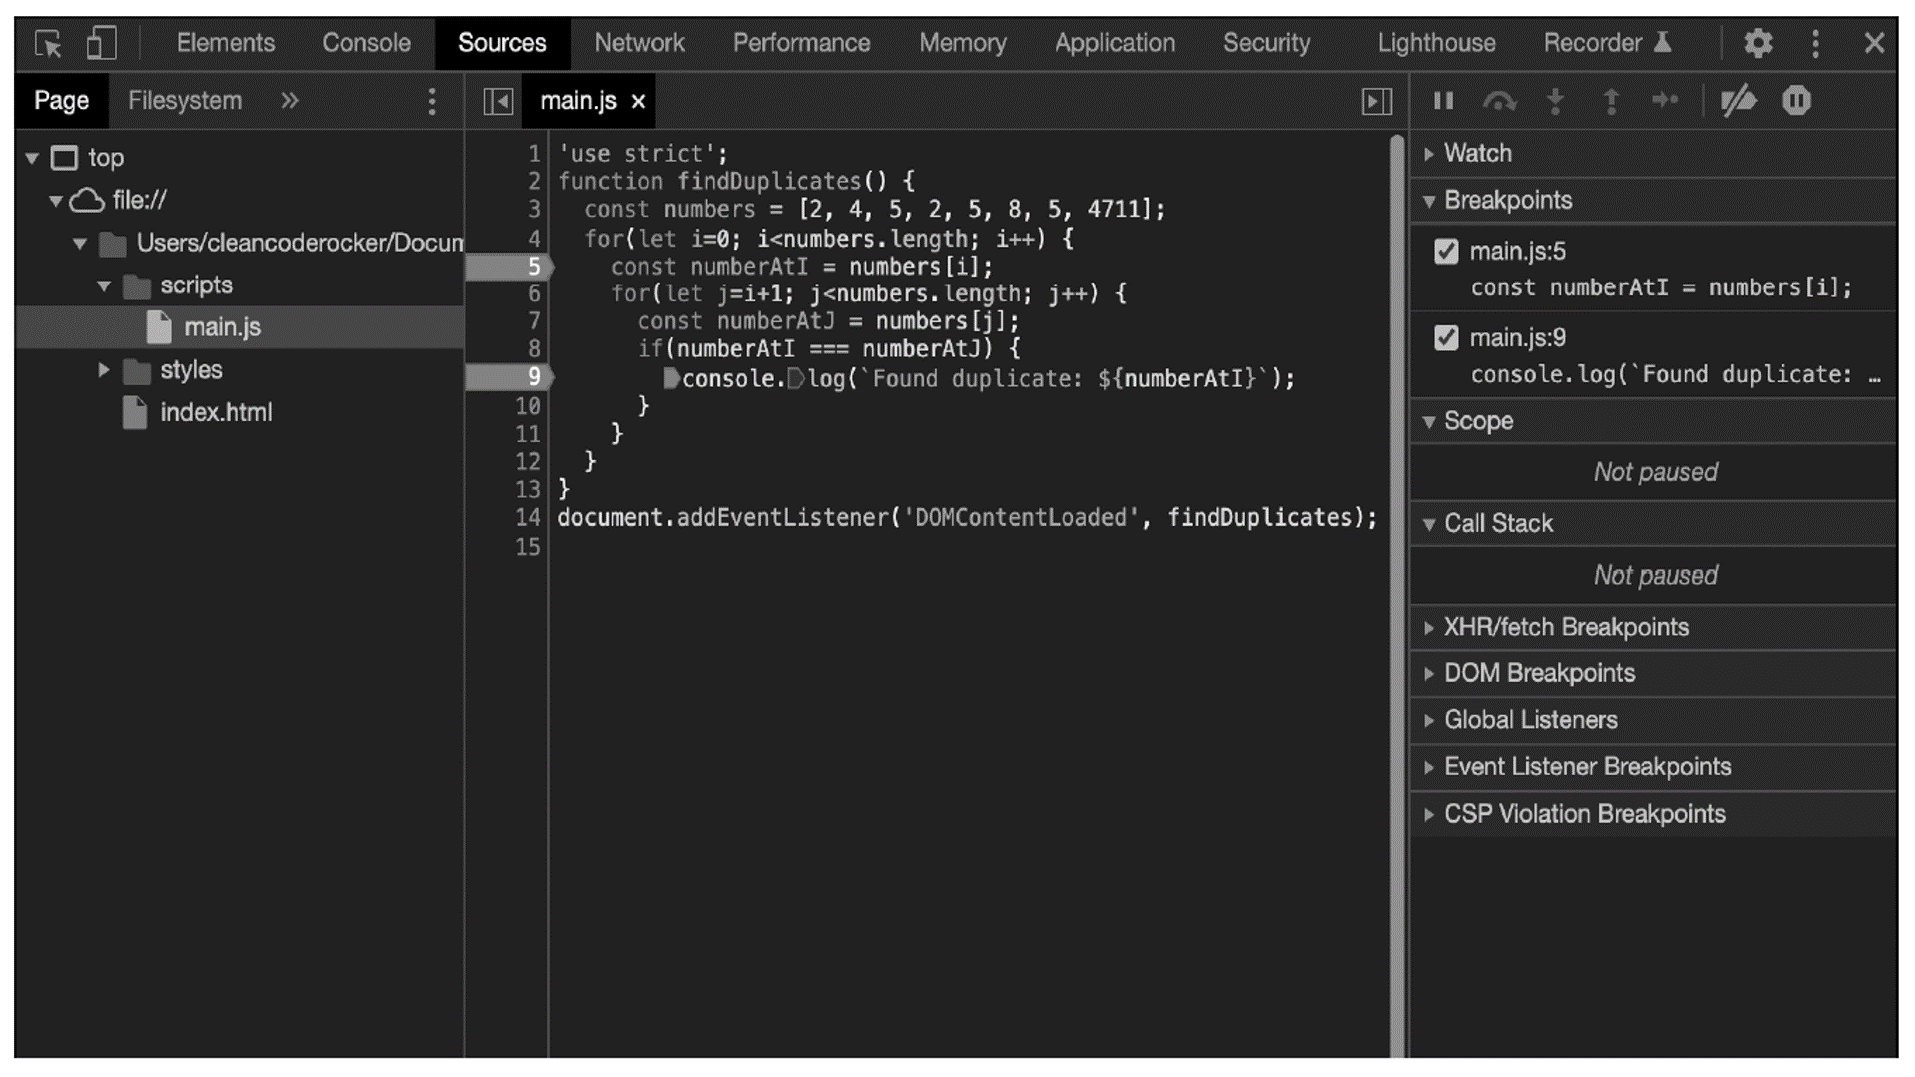
The breakpoints are not limited to a single source code file but can be used arbitrarily within a program, even if your program consists of several source code files.
Other Types of Breakpoints
Besides "normal" breakpoints, where a program stops whenever the corresponding line of code is reached, there are other types of breakpoints:
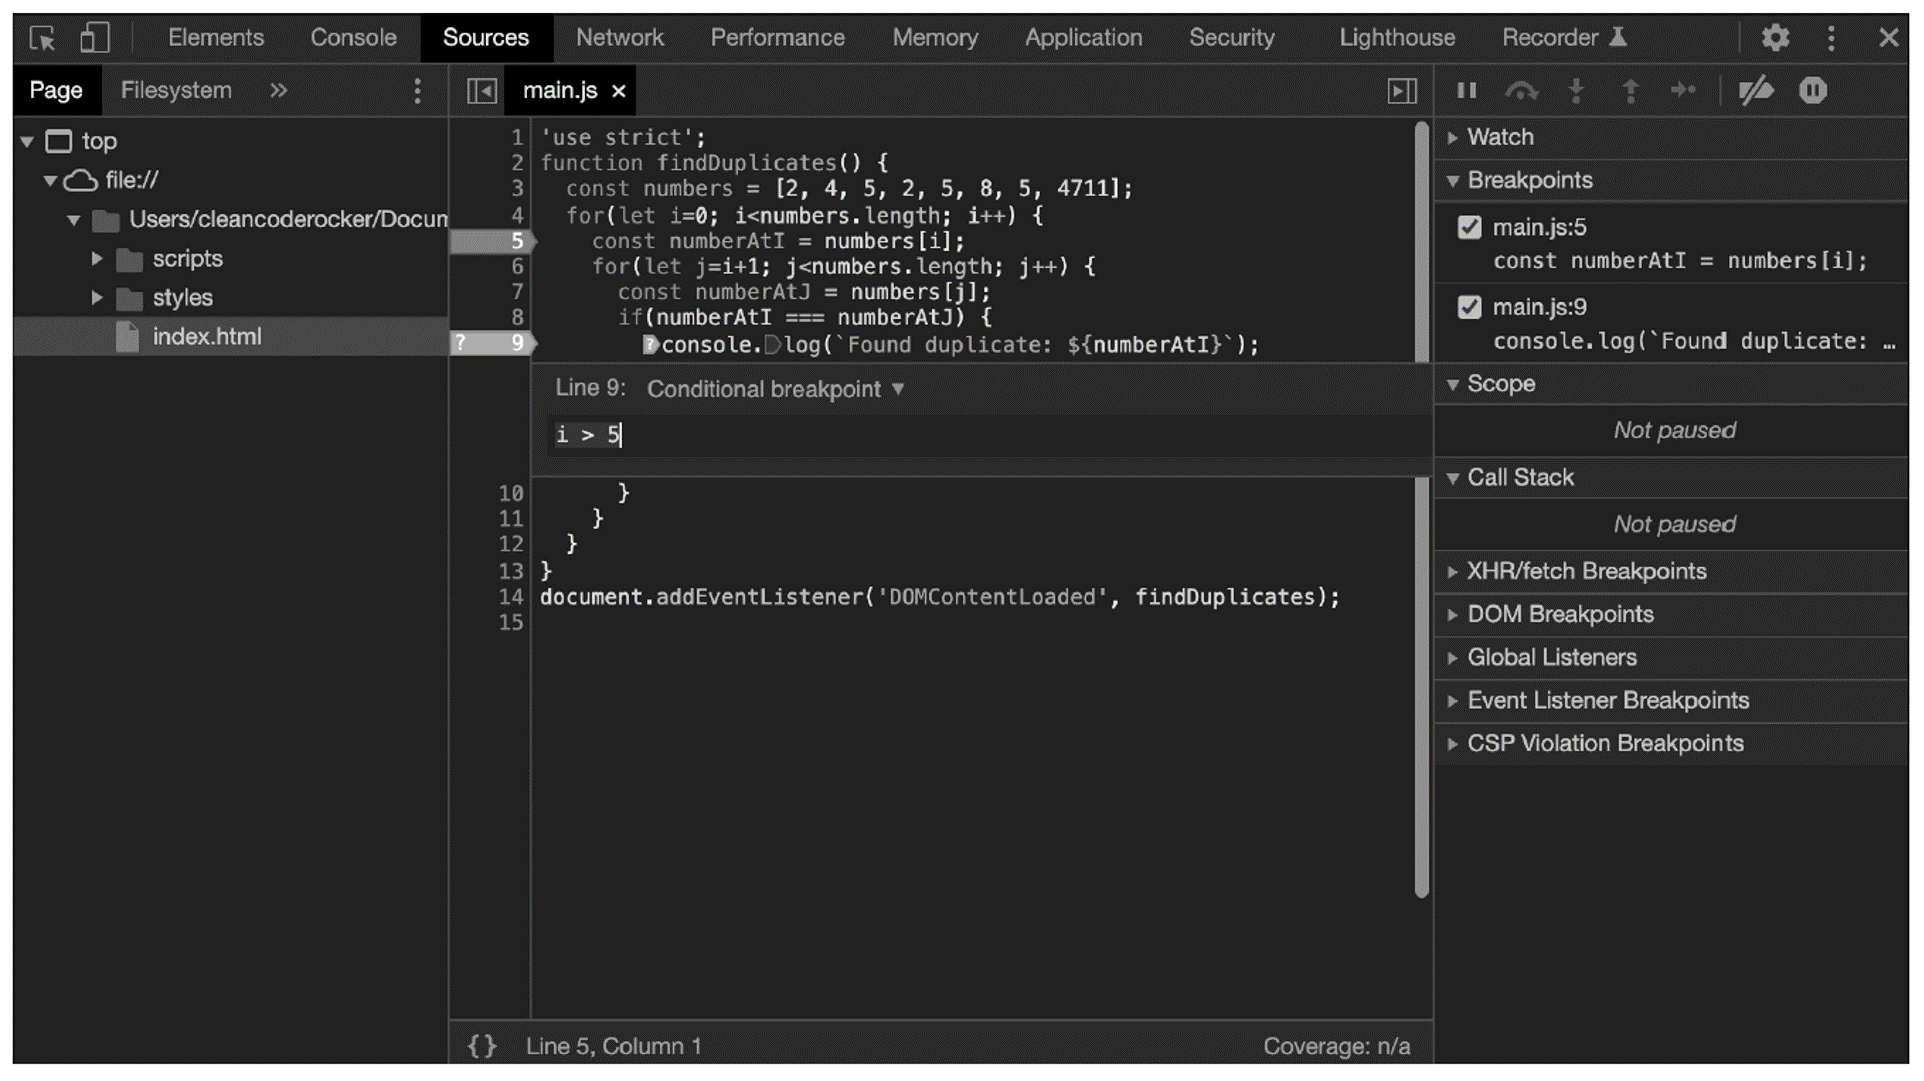
- Conditional breakpoints allow the execution to stop at the corresponding line of code only if the condition associated with the breakpoint is met (see figure below).
- DOM breakpoints allow the execution to stop when the content of a web page has been dynamically modified.
- Event listener breakpoints allow the execution to stop when a specific event is triggered within a web page.
- XHR breakpoints allow the execution to stop when an Ajax call is executed.
Viewing the Function Call Stack
In addition to the variable assignment, you can also display the function call stack. The best way to illustrate this is to change the code example from earlier to call multiple functions.
In the code below, some of the logic from the findDuplicates() function has been moved to new functions: the contents of the outer loop are now in the checkNumber() function, which is called with the current number as the first argument and the entire array as the second argument.
In addition, the contents of the inner loop are in the compareNumbers() function. That is, the findDuplicates() function calls the checkNumber() function for each number in the array, which in turn calls the compareNumbers() function for each subsequent number.
function compareNumbers(numberAtI, numberAtJ) {
if(numberAtI === numberAtJ) {
console.log(`Found duplicate: ${numberAtI}`);
}
}
function checkNumber(numberAtI, numbers, i) {
for(let j=i+1; j<numbers.length; j++) {
const numberAtJ = numbers[j];
compareNumbers(numberAtI, numberAtJ);
}
}
function findDuplicates() {
const numbers = [2, 4, 5, 2, 5, 8, 5, 4711];
for(let i=0; i<numbers.length; i++) {
checkNumber(numbers[i], numbers, i);
}
}
document.addEventListener('DOMContentLoaded', findDuplicates);
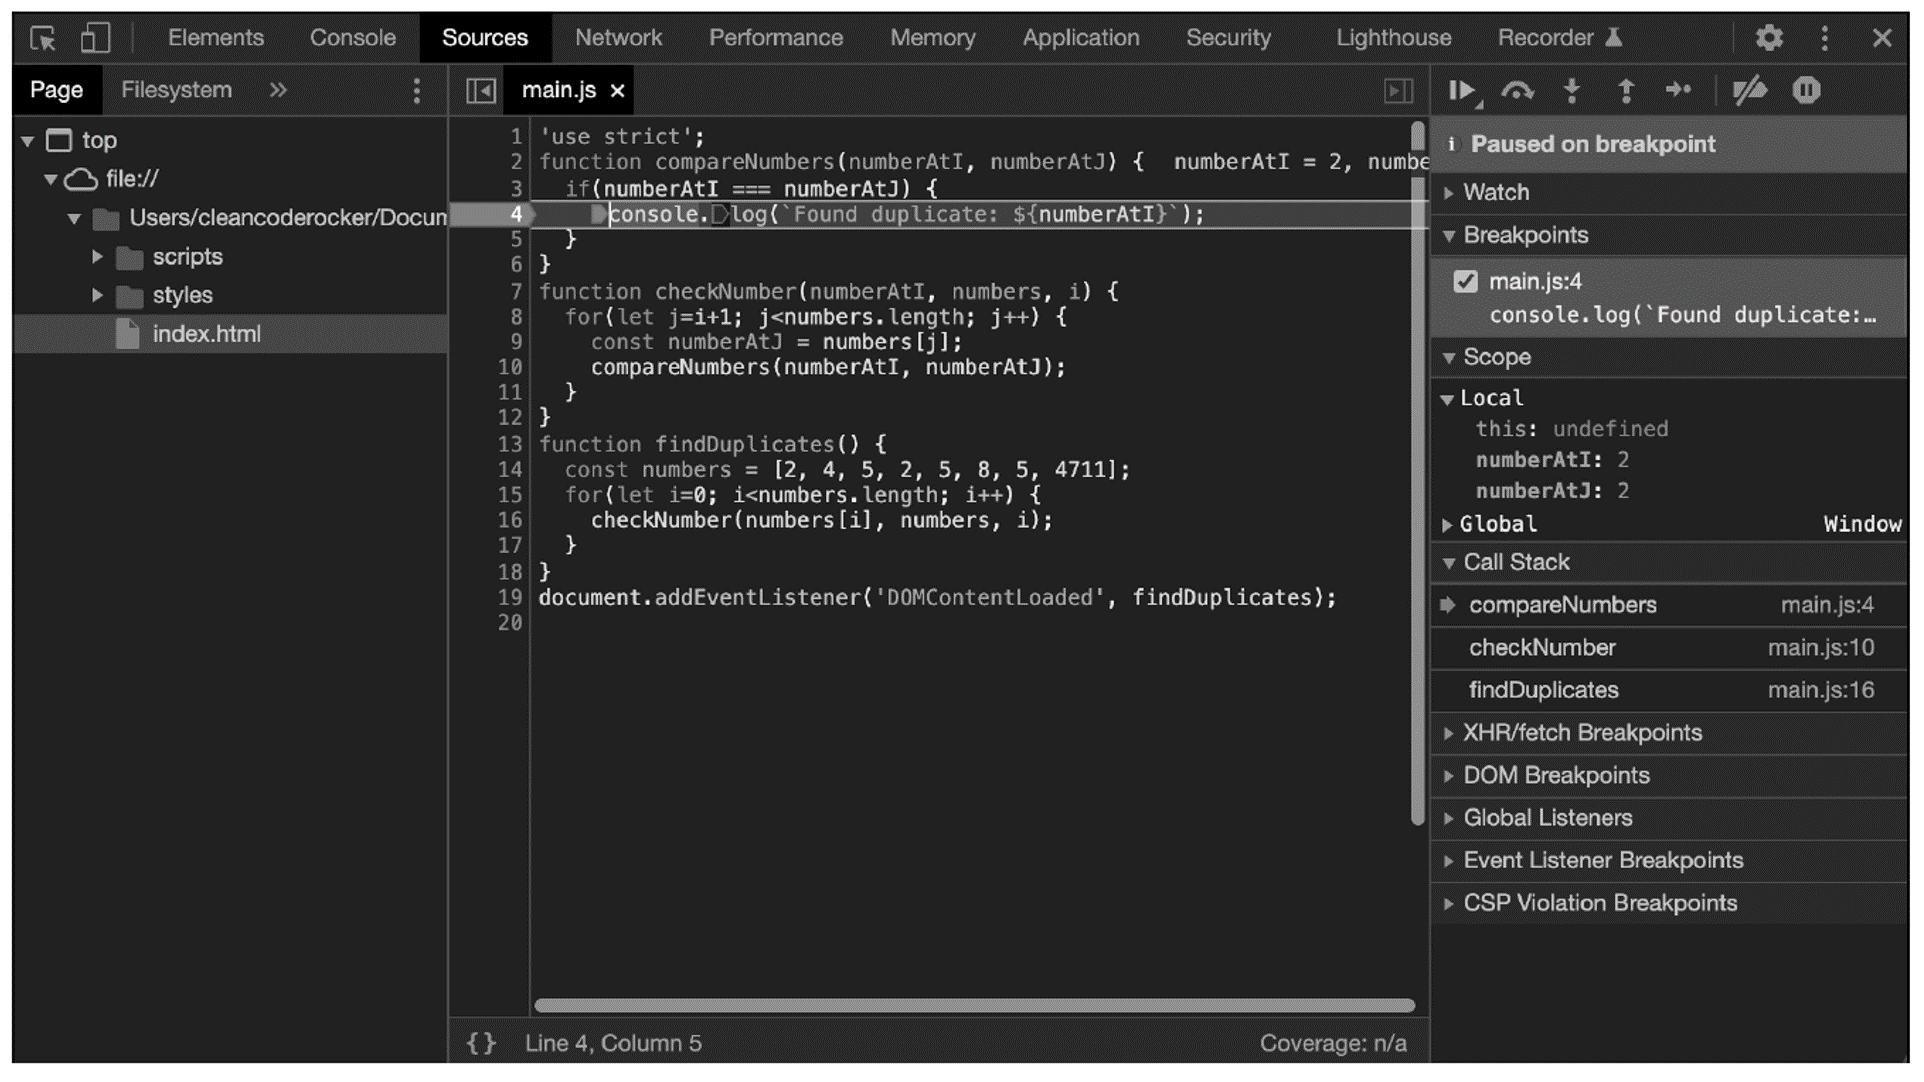
If you now set a breakpoint within the compareNumbers() function, as shown in the final figure, you can nicely see the function call stack. To do this, simply select the Call Stack tab in the right pane. There, the function name on top represents the current function, the function below it the one from which the current function was called, and so on.
Editor’s note: This post has been adapted from a section of the book JavaScript: The Comprehensive Guide by Philip Ackermann. Philip is the CTO of Cedalo GmbH and the author of several reference books and technical articles on Java, JavaScript, and web development. His focus is on the design and development of Node.js projects in the areas of Industry 4.0 and Internet of Things.
This post was originally published 8/2022.



Comments